Block Diagram
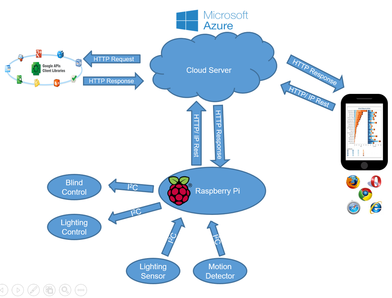
As we can see from the block diagram, in this project we achieve the following:
1. The two sensor, Light and Passive Infrared Sensor, collect and transfer data to the Rpi through the i2c protocol in the case of the light sensor.
2. The Rpi is in turn communicating with the server on the cloud which collects the data from the Rpi and analyzes and processes it.
3. The cloud is home to the databases which contain the data from the sensors as well as the user required settings.
4. The functions achieved are thus: If the light sensor picks up more than sufficient ambient light intensity then the server asks the Rpi to close the blinds to reduce the light intensity by moving the motors connected to the Rpi and vice versa in the case of low ambient lighting. And, if the PIR sensor picks up movement detecting the presence of someone, the server asks the Rpi to switch on the LED.
5. The server also visualizes the data it has collected and stored through webpages displaying charts for analyzing the light intensity, motor movement and hence energy consumed vs energy saved.
6. The mobile app communicates with the server and has control as well as visualization options.
